RE/MAX NATIONAL HOUSING REPORT Q1 2019
According to Lightstone Property data, a total of 39,836 bond registrations were recorded at the Deeds Office over the period of January - March 2019, totalling an amount of R43,880,124,000. This translates into a 5.7% decrease in the amount of bonds registered since the last quarter of 2018. The number of transfers (both bonded and unbonded) recorded at the Deeds Office between January and March also decreased by 7.7% from the fourth quarter to 57,338 transfers in the first quarter of 2019.
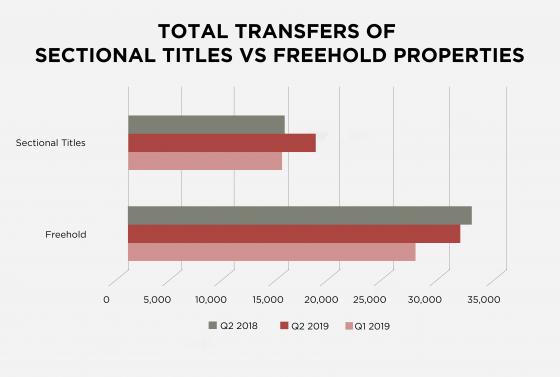
Of these transfers, a total of 27,719 freehold properties and 14,388 sectional title units were sold countrywide (*these figures exclude estates, farms, and land only transfers). These figures translate into a 4.9% drop in the number of freehold properties sold in the third quarter and a substantial 8.1% decrease in the number of sectional title units sold.
“The first quarter of the year is normally slower than the rest of the year, so it is not unusual to see the number of transactions wane over this time. However, it is encouraging to see that we experienced steady growth on the figures for the first quarter of 2018. For example, the first quarter of 2019 experienced a 25% growth on the number of bonds registered in the first quarter of 2018. This means that the banks’ lending appetite has increased, which is a positive for buyers. The number of freehold properties and sectional titles sold also increased by 27% and by 45% respectively on Q1 2018’s figures (21,783 versus 27,719 freehold properties & 9,928 versus 14,388 sectional titles),” explains Adrian Goslett, Regional Director and CEO of RE/MAX of Southern Africa.
House prices have also reflected some sturdy growth this quarter. According to Lightstone data, the current national median price of a freehold home has grown by 8.5% on the median askingproce for Q1 2018 to R1,122,349 in Q1 2019. Likewise, the national median price of a sectional title grew by 5.2% to R1,049,810. The average active RE/MAX listing price for this period also increased by 9% from Q1 2018 and amounted to R2,598,255.74. Finally, the average bond amount granted during this period saw an increase of 4.4% to R1,102,000 in the first quarter of 2019, which likewise reflects an increased lending appetite by financial institutions.
“Bar ongoing concerns around our national power utility, there have been several positive outcomes for the South African property market during the first quarter. Our interest rates and credit rating have remained stable, which encourages investor confidence in the market. Though it might take some time before we see a full recovery, quite possibly – and contrary to what others in the industry might think – we are already beginning to see the long-term price curve of a real estate market that is preparing to shift from a buyer’s market into a seller’s market post-elections,” Goslett explains.
Stability in the Luxury Market
Interestingly, transactions within the affordable housing price brackets have seen far less activity than in previous quarters. In the first quarter of 2019, 29.2% of transfers fell within the R0 – R400,000 price range; 24.4% were priced between R400,000 and R800,000; 25.2% were between R800,000 and R1,5 million; 15.8% were between R1,5 million to R3 million; and, transactions over R3 million accounted for 5.4% of all bond registrations for the fourth quarter.
“The high-end market was the least affected by the overall decrease in number of registered transactions which normally occurs in the first quarter of the year. While there was an 8.5% decrease in the number of transactions priced below R400,000 compared to Q4 2018, properties over R3 million only saw a 0.8% decrease. This same segment has grown to 5.4% of all transactions this quarter, which is the largest this segment has been since the third quarter of 2017 at 5.62%,” says Goslett.
Province Performance Breakdown
The Western Cape and Gauteng were the only two provinces to make it onto the Top 5 searched suburbs nationally on remax.co.za during Q1 2019. Parklands in the Western Cape placed first, followed by Glen Marais in Gauteng, then Sunningdale in the Western Cape, and lastly Morningside and Bryanston in Gauteng. According to Private Property statistics, the Western Cape still has the highest national median asking price. However, the Western Cape saw a 0.4% drop in median asking price compared to the fourth quarter of 2018, whereas Gauteng saw a 0.4% increase on last quarter’s figures. Overall, KwaZulu-Natal reflected the highest quarter-on-quarter growth, with the median asking price increasing by 3.2% on last quarter. Conversely, the North West reflected the largest drop in median asking price with a 2.6% decrease on last quarter’s figures.

Need help?
Confused by what all this means for you? Why not chat to a trusted real estate advisor from the largest real estate brand in Southern Africa? Click here to get in touch with your nearest office: https://www.remax.co.za/real-estate-offices/


Send to a Friend